So- Just a quick example on how to execute a trendline for the percentage change on a chart.
This can be useful for predicting future change, and allows you to more easily at a glance determine the current trend of your data, when it may not be clear.
Lets start with some base data.

In the above data, the goal is to display the percentage change week to week, as a easy-to-view trendline.
First- we need to calculate the percent change from one interval to the next. Thankfully- this is pretty easy with streamstats.
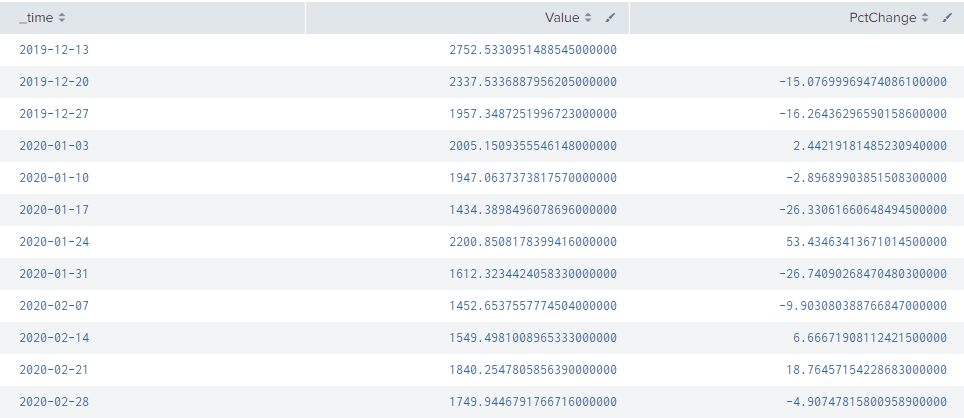
| streamstats current=f window=1 values(Value) as PValue
| eval PctChange = ((Value-PValue)/PValue)*100
| fields - PValue
For an explanation- “streamstats current=f window=1 values(Value) as PValue” will store the previous value as new variable, “PValue”.
We can then use the new variable to calculate the percentage change. This leaves us with the following data.
While, at this point, we could now enable an overlay for PctChange- it does not clearly display our trend. The goal, is for whoever looks at this chart, to be able to clearly see how the data is trending over time.

To better accomplish the goal, we are going to utilize the trendline command.
The documentation for Trendline can be found here: Trendline
For this example, we are going to do a simple moving average, for at least 4 periods.
| trendline sma4(PctChange) as PctChangeTrend
This should be adequate for smoothing out the results.

Lastly- I do recommend setting the intervals for your overlay to produce an easily distinguishable trend.
Here is my final query:
| inputlookup temp_1.csv
| timechart span=1w sum(value) as Value
| streamstats current=f window=1 values(Value) as PValue
| eval PctChange = ((Value-PValue)/PValue)*100
| trendline sma4(PctChange) as PctChangeTrend
| fields - PValue PctChange
